Current
location:
Current
location: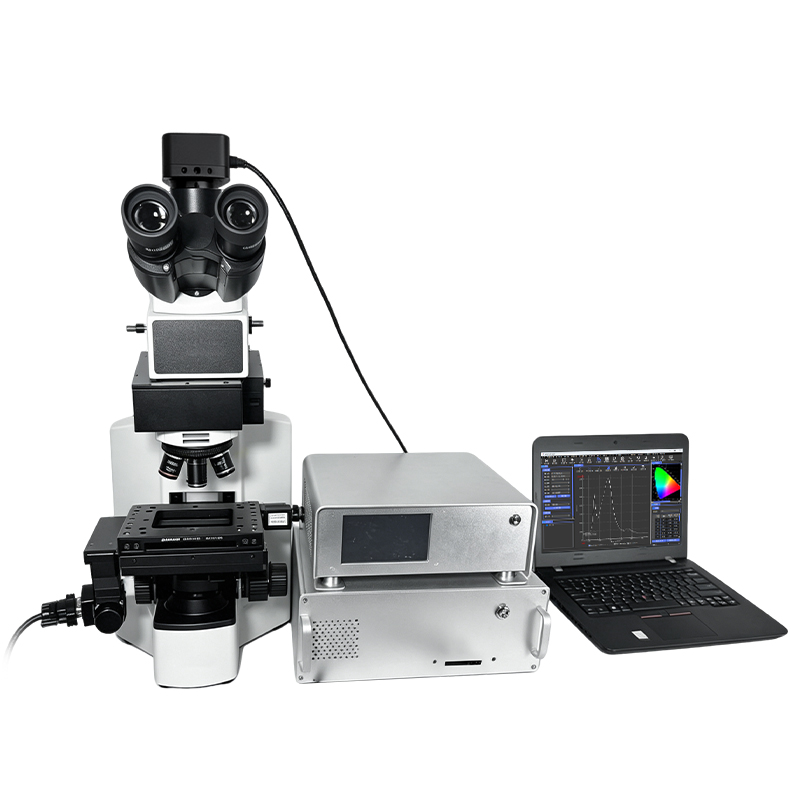

Product Introduction
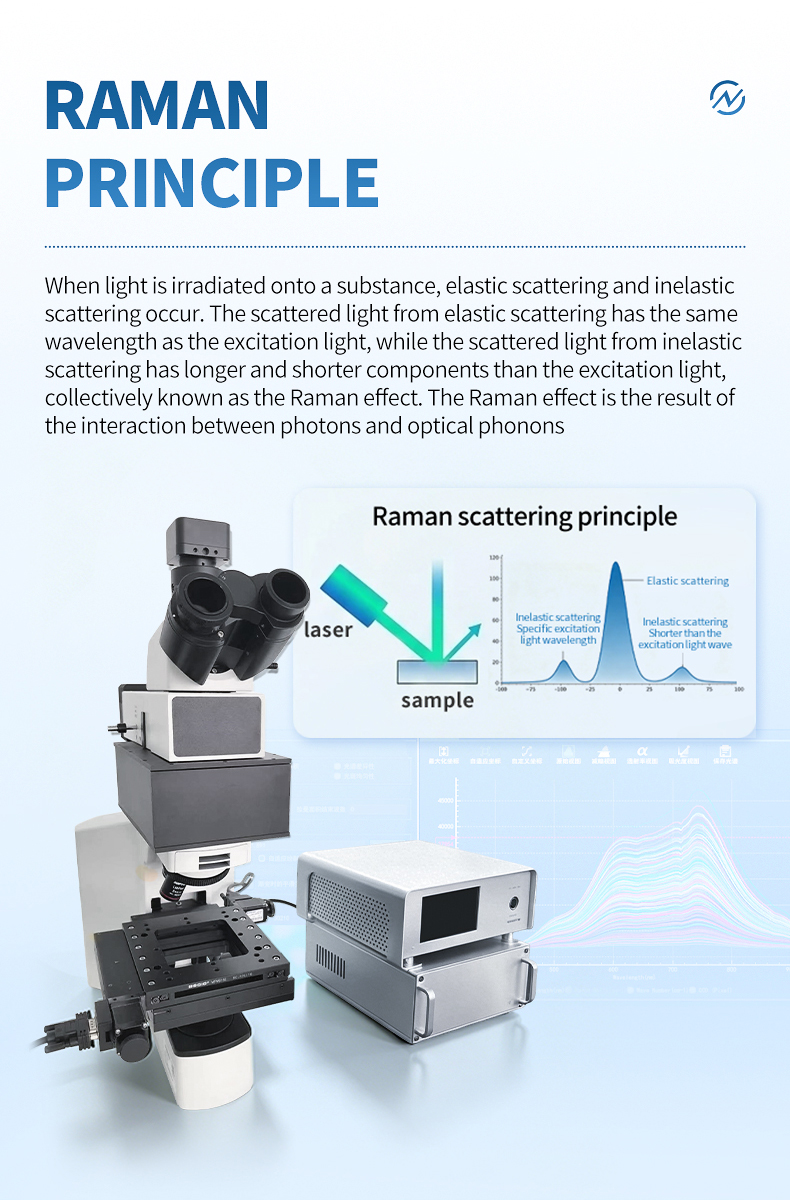
Modern pharmaceutical QC and biomedical research demand not just point identification, but comprehensive spatial understanding of compound distribution. Is the API uniformly dispersed? Does the tumor margin show a sharp biochemical transition? These spatial questions cannot be answered by single-point measurements, yet organic samples needing spatial analysis are precisely those most prone to fluorescence under visible-wavelength Raman excitation.
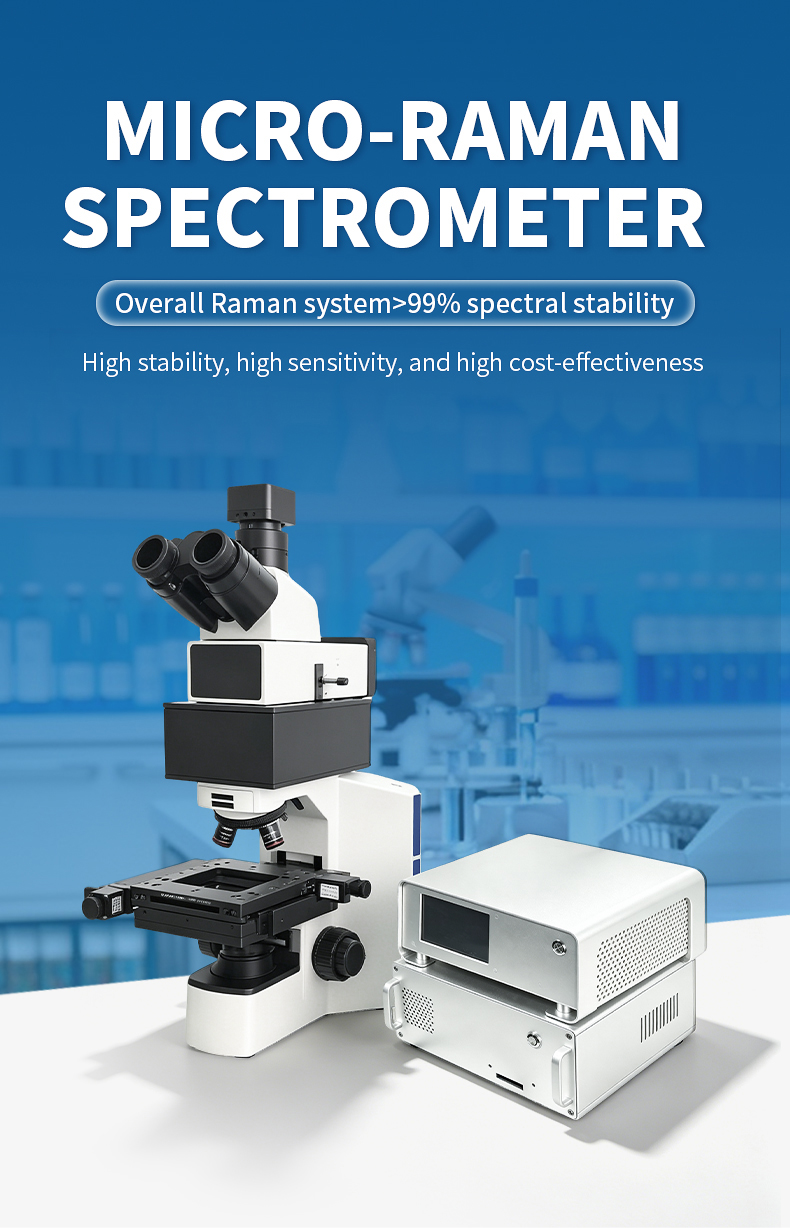
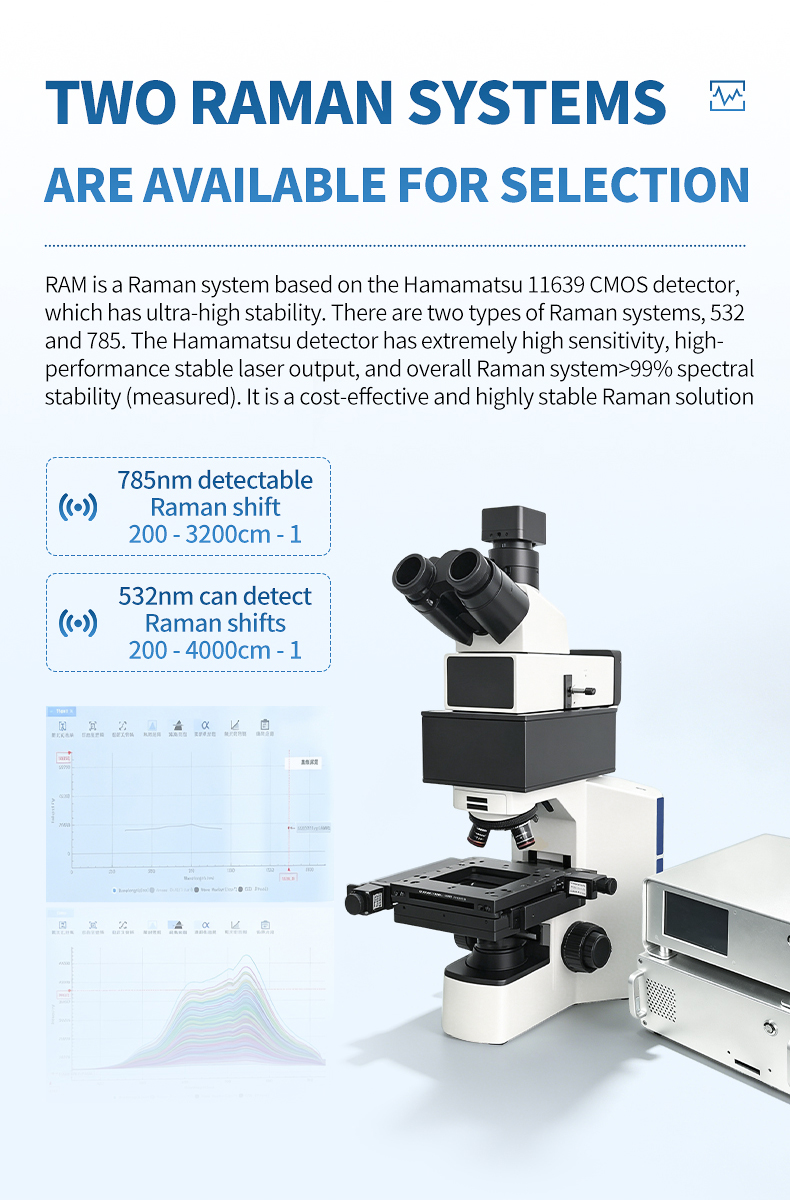
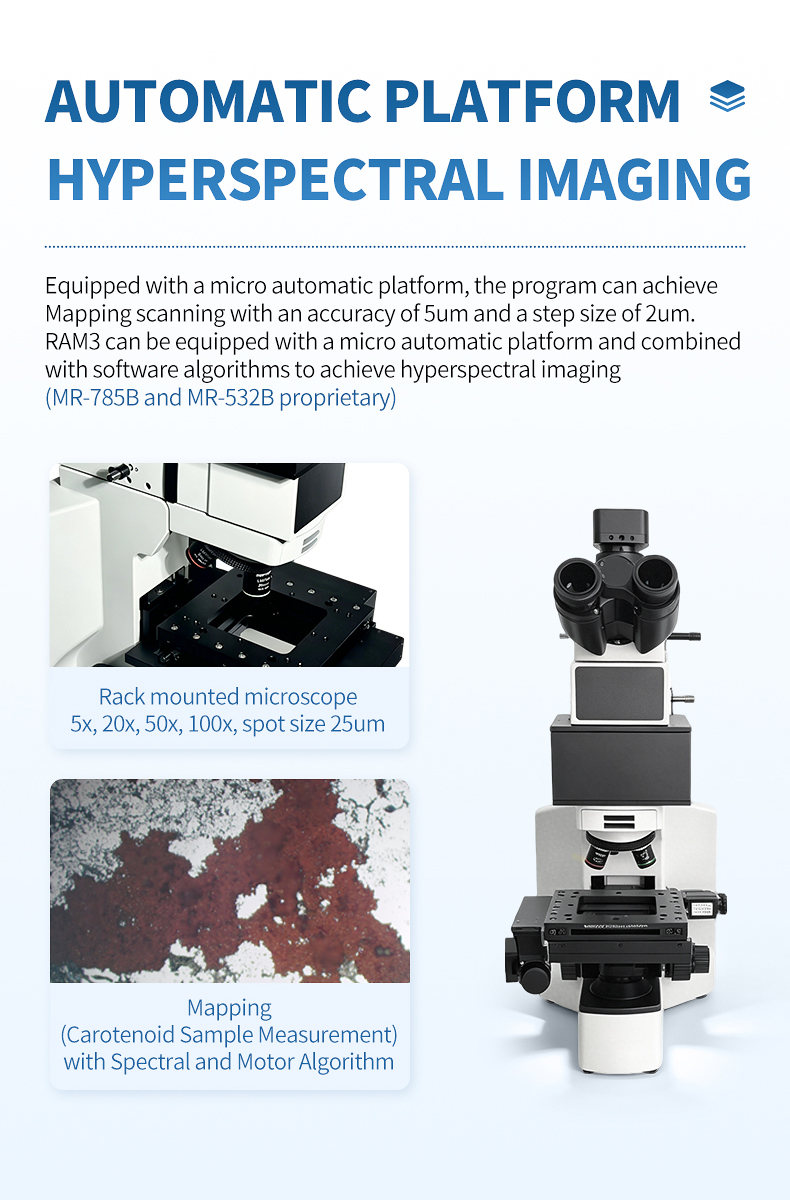
The MR-785B resolves this dual challenge by integrating 785 nm NIR excitation with a motorized X-Y stage for automated chemical imaging. The 5 μm accuracy and 2 μm step size enable mapping at scales relevant to pharmaceutical granules, tissue microarchitecture, and microplastic particles. Autofocus tracking ensures surface height variations do not degrade spectral quality.
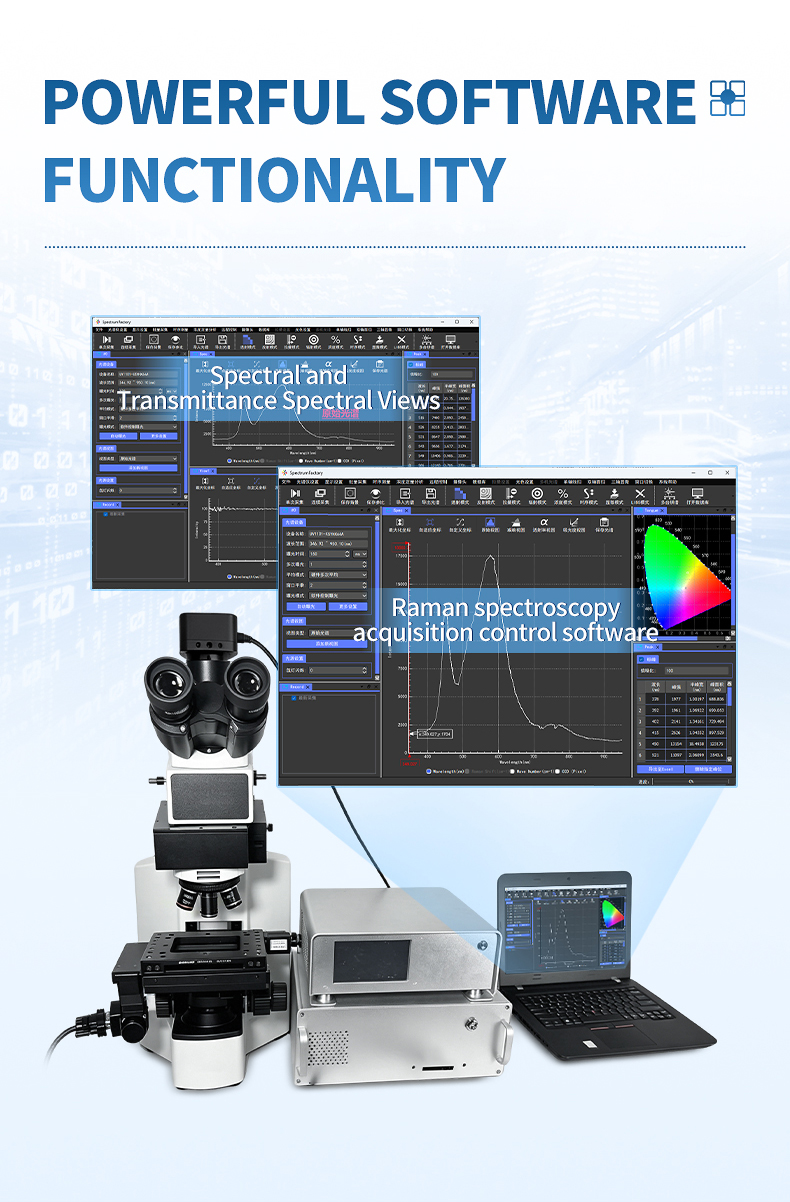
The 1200 gl/mm grating blazed at 800 nm and Hamamatsu CMOS detector (2048 pixels, >99.8% linearity) deliver 200–3200 cm⁻¹ coverage with 7 cm⁻¹ resolution. SpectrumFactory software orchestrates the complete workflow from ROI definition through automated grid acquisition to PCA-based chemical image generation. For pharmaceutical QC, pathology research, and microplastic screening, the MR-785B delivers fluorescence-free spatial analytics. See our brand recommendation guide.
Applications
- Pharmaceutical tablet homogeneity mapping — Generate full-surface API distribution maps revealing segregation patterns, agglomerates, and content uniformity issues that affect drug release profiles and regulatory compliance
- Drug coating layer analysis — Map coating thickness uniformity and compositional gradients across tablet surfaces, supporting process optimization for enteric and controlled-release formulations
- Tumor margin biochemical imaging — Spatially resolve protein, lipid, and nucleic acid transitions at tumor-stroma interfaces in unstained tissue sections, supporting surgical margin assessment research
- Atherosclerotic plaque characterization — Map lipid core, fibrous cap, and calcified regions in arterial cross-sections for cardiovascular research and device development
- Environmental microplastic area scanning — Automated large-area scanning of filter membranes with spectral library matching to classify particles by polymer type and generate spatial distribution maps
- Pharmaceutical counterfeit spatial analysis — Detect regional compositional anomalies in suspect tablets that indicate poor manufacturing quality or deliberate adulteration patterns
- Polymer blend morphology mapping — Visualize phase separation, domain size, and additive distribution in pharmaceutical packaging polymers and biomedical device materials
- Forensic evidence area scanning — Systematic automated search for drug particles, explosive residues, and trace evidence on large evidence substrates with fluorescence-free spectral identification
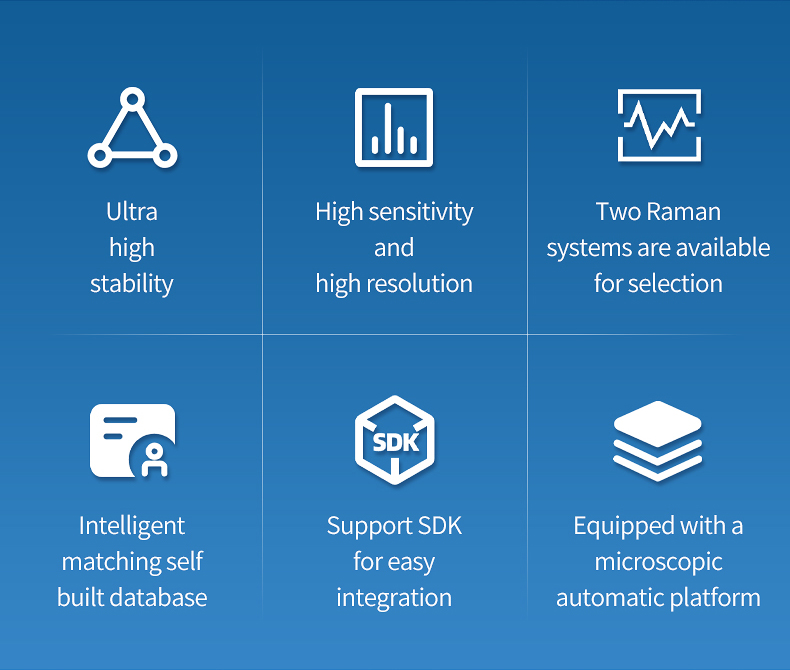
Key Features and Advantages
- 785 nm NIR excitation eliminates fluorescence from organic pharmaceutical formulations, biological tissues, and environmental samples — enabling clean Raman spectra that visible-wavelength mapping systems cannot produce
- Motorized X-Y stage with 5 μm accuracy and 2 μm step size maps API granule boundaries, tissue microarchitecture, and individual microplastic particles at pharmaceutically and biologically relevant spatial scales
- 110 mm × 75 mm travel range accommodates entire pharmaceutical tablets, large tissue sections, and standard 47 mm filter membranes in a single automated acquisition without manual repositioning
- Integrated autofocus tracking compensates for tablet cross-section roughness, tissue section folds, and filter membrane irregularities, maintaining spectral quality throughout unattended mapping runs
- 1200 gl/mm grating blazed at 800 nm maximizes throughput at 785 nm, compensating for the inherently weaker Raman scattering at NIR wavelengths to deliver practical mapping speeds for organic samples
- Hamamatsu CMOS detector with 2048 pixels and >99.8% linearity supports quantitative polymorph ratio mapping and tissue biochemistry quantification across thousands of measurement points
- 7 cm⁻¹ spectral resolution resolves polymorph-specific peaks in drug substances and protein conformation bands in tissue, enabling chemically specific false-color image generation
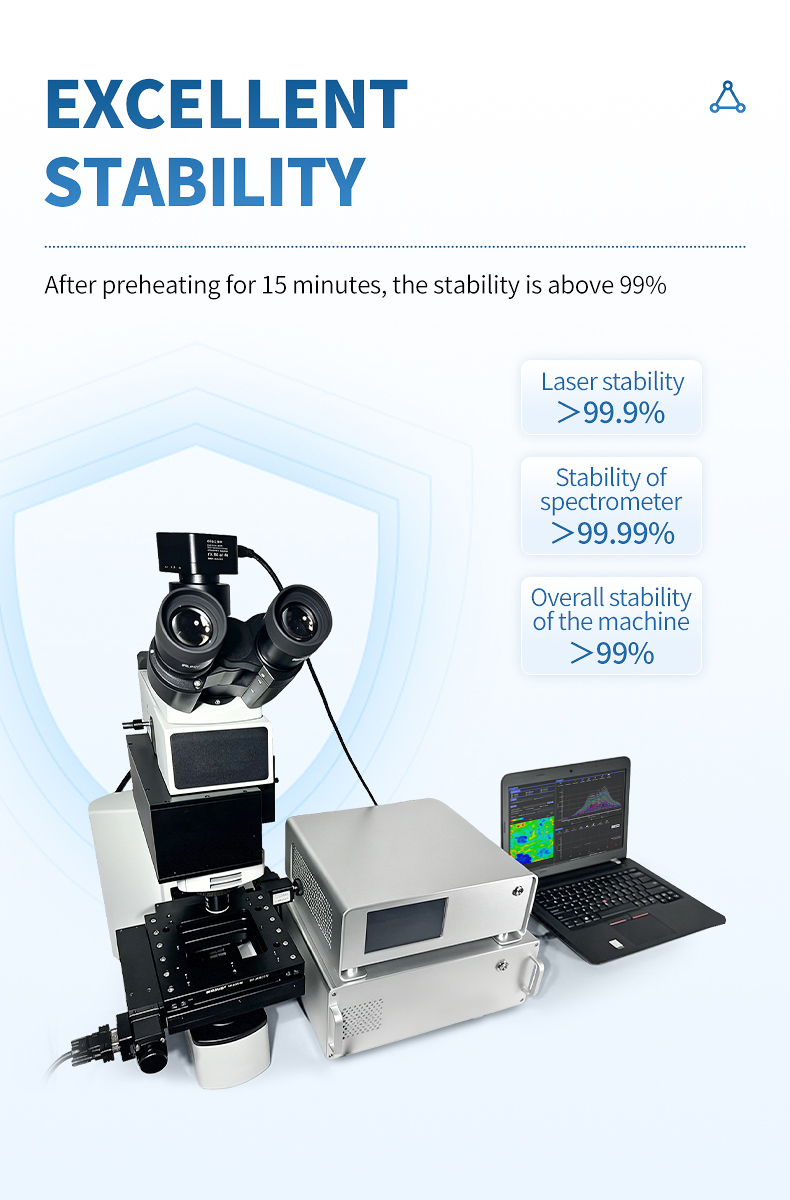
- 8-hour system stability >99% enables overnight mapping of large grids (100 × 100+ pixels) with no spectral drift, ensuring consistent data quality from first to last measurement point
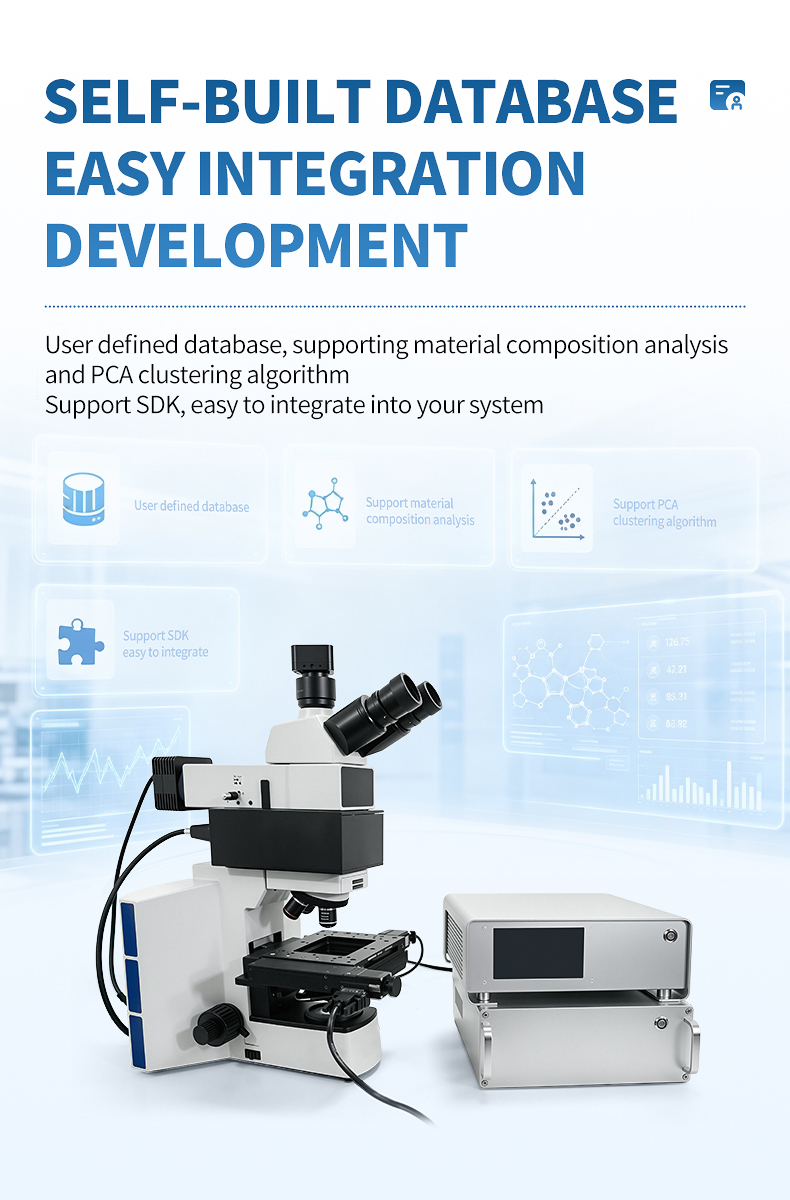
- SpectrumFactory mapping pipeline — ROI definition, automated grid acquisition, airPLS baseline correction, PCA clustering, and chemical image export — produces publication-ready results in a single automated workflow
- PCA clustering identifies chemically distinct regions without prior knowledge, revealing unexpected segregation patterns in tablets, hidden tumor infiltration zones in tissue, or unrecognized polymer types on filter membranes
- Non-destructive measurement preserves pharmaceutical tablets, tissue specimens, and forensic evidence intact for subsequent analysis, archival storage, or regulatory review
- SMA905 fiber interface and GPIO outputs support integration with laboratory automation systems, environmental chambers, and custom sample handling fixtures
- External trigger with 5 ns latency enables hardware-synchronized acquisition for position-correlated measurements in automated inspection workflows
- Compact rack-mounted footprint with standard power requirements enables installation in GMP quality control laboratories without infrastructure modifications
Technical Specifications
| Parameter | Specification |
|---|---|
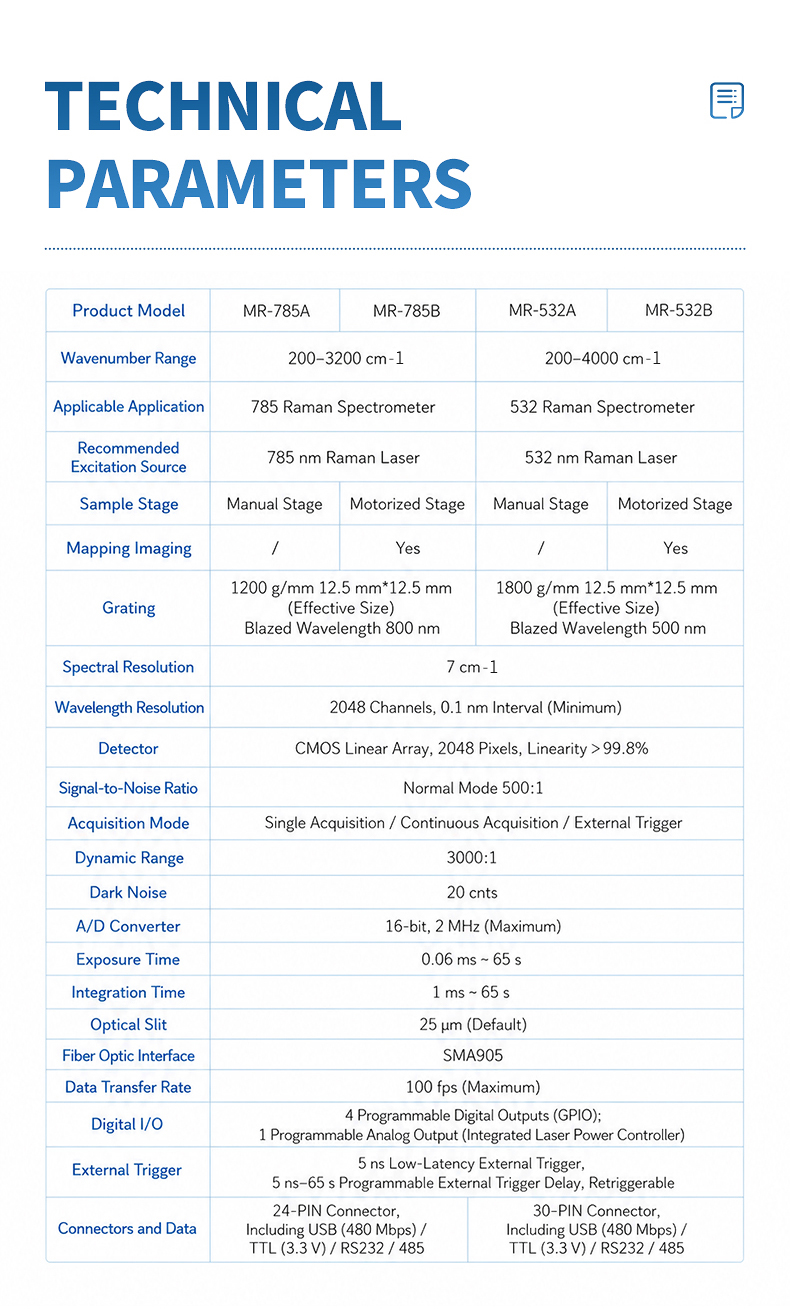
| Product Model | MR-785B |
| Excitation Wavelength | 785 nm |
| Wavenumber Range | 200–3200 cm⁻¹ |
| Spectral Resolution | 7 cm⁻¹ |
| Grating | 1200 gl/mm, 12.5 mm × 12.5 mm, blazed at 800 nm |
| Detector | Hamamatsu CMOS linear array, 2048 pixels, linearity > 99.8% |
| Wavelength Resolution | 2048 channels, 0.1 nm interval (minimum) |
| Signal-to-Noise Ratio | 500:1 (normal mode) |
| Dynamic Range | 3000:1 |
| Dark Noise | 20 counts |
| A/D Converter | 16-bit, 2 MHz (maximum) |
| Acquisition Mode | Single / Continuous / External trigger / Mapping grid |
| Exposure Time | 0.06 ms – 65 s |
| Integration Time | 1 ms – 65 s |
| Optical Slit | 25 μm (default) |
| Sample Stage | Motorized mapping platform |
| Stage Travel Range | X: 110 mm, Y: 75 mm |
| Positioning Accuracy | 5 μm |
| Minimum Step Size | 2 μm |
| Autofocus | Integrated focus tracking for mapping |
| Microscope | Rack-mounted, 5x / 20x / 50x / 100x objectives |
| Spot Size | 25 μm |
| Fiber Optic Interface | SMA905 |
| Data Transfer Rate | 100 fps (maximum) |
| Digital I/O | 4 programmable GPIO; 1 analog output |
| External Trigger | 5 ns latency, 5 ns–65 s delay, retriggerable |
| Connectors | 30-pin (USB 480 Mbps / TTL 3.3 V / RS232 / RS485) |
| System Stability | Laser >99.9%, Spectrometer >99.99%, Overall >99% (8h after 15-min warm-up) |
FAQ
Q: How does automated mapping improve pharmaceutical QC compared to single-point Raman measurements?
A: Single-point measurements may miss critical heterogeneity. A tablet could show correct polymorph at five points while harboring a segregation zone between them. Automated mapping collects spectra at every grid point, revealing API distribution, polymorph consistency, and excipient segregation patterns — spatial intelligence increasingly required by regulatory agencies.
Q: What is the practical mapping speed for pharmaceutical tablet analysis at 785 nm?
A: A typical 50 × 50 grid with 5-second integration takes approximately 4–5 hours. A 25 × 25 grid completes in about 1 hour, often sufficient for uniformity assessment. The 8-hour stability enables overnight unattended operation.
Q: Can the MR-785B map tissue biochemistry without staining or labeling?
A: Yes. Unstained tissue sections are placed directly under the microscope for automated mapping. 785 nm minimizes autofluorescence, revealing protein, lipid, and nucleic acid bands. PCA clustering automatically identifies biochemically distinct regions — distinguishing tumor core, invasive margin, and normal stroma without any labeling.
Q: How does the system classify microplastic particles on filter membranes?
A: The system scans the entire filter membrane on a predefined grid. At each point, the spectrum is compared against the polymer library to identify polymer type (PE, PP, PET, PS, etc.). The software generates a false-color map showing particle locations by type, along with count and size statistics. 785 nm excitation avoids fluorescence from environmental contaminants.
Q: Is the MR-785B suitable for GMP pharmaceutical environments?
A: Yes. Non-destructive measurement preserves samples for regulatory review. Software supports audit trails and access controls. The system can be calibrated against pharmacopeial standards with IQ/OQ documentation available. The compact design fits standard benches with 8-hour stability eliminating recalibration interruptions.
Q: Can I export mapping data for custom analysis in external software?
A: Yes. SpectrumFactory exports individual spectra as CSV or SPC, chemical maps as PNG/TIFF/BMP, and complete datasets as project files. Raw spectral data cubes import into MATLAB, Python, R, ENVI, or commercial platforms. PCA component spectra and score images export separately for publication.
Article address:https://www.spectrometer.top/micro-raman-spectrometer/automated-pharmaceutical-tissue-raman-mapping.html
- Previous: MR-785A Raman Spectrometer for Pharmaceutical and Biomedical Analysis
- Next: no more